
Labor Advantages
Strengths Of The St. Joseph, Missouri Labor Market
St. Joseph’s location gives access to a population of nearly 700,000 people and over 350,000 workers. Our location acts as a crossroads for two major thoroughfares, Interstate 29 and U.S. Highway 36, plus available rail service via Union Pacific and Burlington Northern Santa Fe provides us with tremendous transportation assets. Not to mention, St. Joseph is just 35 minutes from Kansas City International Airport (KCI).
Along with our location and transportation advantages, we have an unmatched advantage in our trained and growing workforce.
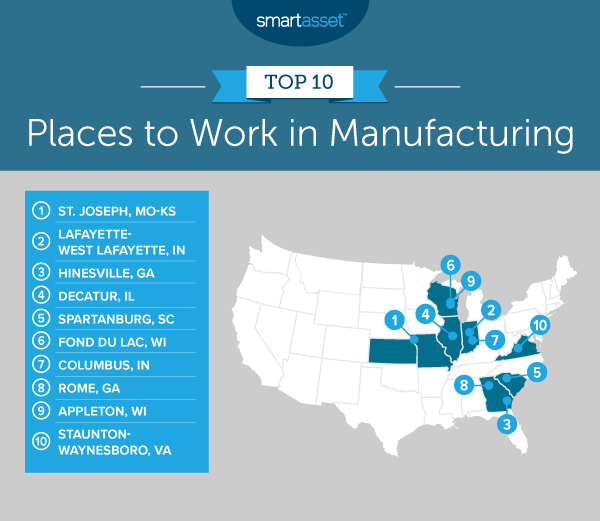
St. Joseph ranks first in list of 'Best Places to Work in Manufacturing'
Compared to the National Average St. Joseph has 2X the Manufacturing Labor:
- 63X more people employed in Metal Can Manufacturing
- 52X more people employed in Biological Product Manufacturing
- 50X more people employed in Pesticide and Other Agricultural Chemical Manufacturing
- 47X more people employed in Storage Battery Manufacturing
- 22X times more people employed in Dog and Cat Food Manufacturing
Tremendous Location & Access to Workers
St. Joseph’s location gives us access to a highly trained workforce. Our location and interstate access provide us with a high concentration of skilled workers that can’t be beat.

- 107 times the national average of people employed in Leather and Hide Tanning and Finishing
- 77 times the national average of people employed in Line-Haul Railroads
- 63 times the national average of people employed in Metal Can Manufacturing
- 52 times the national average of people employed in Biological Product (except Diagnostic) Manufacturing
- 50 times the national average of people employed in Pesticide and Other Agricultural Chemical Manufacturing
- 48 times the national average of people employed in Fats and Oils Refining and Blending
- 47 times the national average of people employed in Soybean and Other Oilseed Processing
- 47 times the national average of people employed in Storage Battery Manufacturing
- 39 times the national average of people employed in Steel Foundries (except Investment)
- 38 times the national average of people employed in Animal (except Poultry) Slaughtering
- 38 times the national average of people employed in Flour Milling
- 35 times the national average of people employed in Steel Wire Drawing
- 31 times the national average of people employed in All Other Miscellaneous Fabricated Metal Product Manufacturing
- 22 times the national average of people employed in Dimension Stone Mining and Quarrying
- 22 times the national average of people employed in Dog and Cat Food Manufacturing
- 20 times the national average of people employed in Nonferrous Forging
- 19 times the national average of people employed in Prefabricated Metal Building and Component Manufacturing
- 15 times the national average of people employed in Sheep Farming
- 15 times the national average of people employed in Distilleries
- 13 times the national average of people employed in Secondary Smelting, Refining, and Alloying of Nonferrous Metal (except Copper and Aluminum)
- 12 times the national average of people employed in Meat Processed from Carcasses
- 12 times the national average of people employed in Support Activities for Rail Transportation
- 12 times the national average of people employed in Oilseed and Grain Combination Farming
- 12 times the national average of people employed in Other Animal Food Manufacturing
- 11 times the national average of people employed in All Other Miscellaneous General Purpose Machinery Manufacturing
- 11 times the national average of people employed in Other Fabricated Wire Product Manufacturing
- 8 times the national average of people employed in Tobacco and Tobacco Product Merchant Wholesalers
- 8 times the national average of people employed in Overhead Traveling Crane, Hoist, and Monorail System Manufacturing
- 7 times the national average of people employed in Unlaminated Plastics Film and Sheet (except Packaging) Manufacturing
- 7 times the national average of people employed in Broom, Brush, and Mop Manufacturing
- 7 times the national average of people employed in Polish and Other Sanitation Good Manufacturing
- 6 times the national average of people employed in All Other Miscellaneous Food Manufacturing
- 6 times the national average of people employed in Crushed and Broken Limestone Mining and Quarrying
- 6 times the national average of people employed in Electric Bulk Power Transmission and Control
- 6 times the national average of people employed in Fertilizer (Mixing Only) Manufacturing
- 5 times the national average of people employed in Crop Production (Proprietors)
- 5 times the national average of people employed in Industrial and Personal Service Paper Merchant Wholesalers
- 5 times the national average of people employed in Farm and Garden Machinery and Equipment Merchant Wholesalers
- 5 times the national average of people employed in Animal Production (Proprietors)
- 5 times the national average of people employed in Plastics Materials and Basic Forms and Shapes Merchant Wholesalers
- 4 times the national average of people employed in Plastics Bottle Manufacturing
- 4 times the national average of people employed in Motor Vehicle Body Manufacturing
- 4 times the national average of people employed in Farm Supplies Merchant Wholesalers
- 4 times the national average of people employed in All Other Grain Farming
- 4 times the national average of people employed in Soil Preparation, Planting, and Cultivating
- 4 times the national average of people employed in Regulation of Agricultural Marketing and Commodities
- 4 times the national average of people employed in Petroleum Bulk Stations and Terminals
- 4 times the national average of people employed in Fossil Fuel Electric Power Generation
- 4 times the national average of people employed in Corn Farming
- 4 times the national average of people employed in Refrigerated Warehousing and Storage
- 4 times the national average of people employed in Ground or Treated Mineral and Earth Manufacturing
- 3 times the national average of people employed in Rail Transportation (non-covered)
- 3 times the national average of people employed in Farm Product Warehousing and Storage
- 3 times the national average of people employed in Specialized Freight (except Used Goods) Trucking, Long-Distance
- 3 times the national average of people employed in Apparel Accessories and Other Apparel Manufacturing
- 3 times the national average of people employed in Truss Manufacturing
- 3 times the national average of people employed in Nursery, Garden Center, and Farm Supply Stores
- 3 times the national average of people employed in Sheet Metal Work Manufacturing
- 3 times the national average of people employed in Other Heavy and Civil Engineering Construction
- 3 times the national average of people employed in Sign Manufacturing
- 3 times the national average of people employed in All Other Transit and Ground Passenger Transportation
- 2 times the national average of people employed in Grain and Field Bean Merchant Wholesalers
- 2 times the national average of people employed in Custom Architectural Woodwork and Millwork Manufacturing
- 2 times the national average of people employed in Pipeline Transportation of Refined Petroleum Products
- 2 times the national average of people employed in Livestock Merchant Wholesalers
- 2 times the national average of people employed in Hog and Pig Farming
- 2 times the national average of people employed in Service Establishment Equipment and Supplies Merchant Wholesalers
- 2 times the national average of people employed in Support Activities for Nonmetallic Minerals (except Fuels) Mining
- 2 times the national average of people employed in Sewage Treatment Facilities
- 2 times the national average of people employed in Employee Bus Transportation
- 2 times the national average of people employed in Special Die and Tool, Die Set, Jig, and Fixture Manufacturing
- 2 times the national average of people employed in Wood Container and Pallet Manufacturing
- 2 times the national average of people employed in Conveyor and Conveying Equipment Manufacturing
- 2 times the national average of people employed in Nonchocolate Confectionery Manufacturing
- 45% growth in Multiple Machine Tool Setters, Operators, and Tenders, Metal and Plastic
- 32% growth in Computer Numerically Controlled Tool Operators
- 28% growth in Food Batchmakers
- 27% growth in Computer Numerically Controlled Tool Programmers
- 19% growth in Industrial Engineers
- 17% growth in Industrial Machinery Mechanics
- 17% growth in Heating, Air Conditioning, and Refrigeration Mechanics and Installers
- 15% growth in Power Plant Operators
- 15% growth in Cutting, Punching, and Press Machine Setters, Operators, and Tenders, Metal and Plastic
- 14% growth in Food and Tobacco Roasting, Baking, and Drying Machine Operators and Tenders
- 13% growth in Mechanical Engineers
- 13% growth in Rolling Machine Setters, Operators, and Tenders, Metal and Plastic
- 13% growth in Aircraft Service Attendants and Transportation Workers, All Other
- 11% growth in Welders, Cutters, Solderers, and Brazers
- 10% growth in Transportation, Storage, and Distribution Managers
- 10% growth in Industrial Production Managers
- 10% growth in Automotive and Watercraft Service Attendants
- 9% growth in Machinists
- 9% growth in Plant and System Operators, All Other
- 9% growth in Maintenance Workers, Machinery
- 8% growth in Electrical, Electronic, and Electromechanical Assemblers, Except Coil Winders, Tapers, and Finishers
- 8% growth in Forging Machine Setters, Operators, and Tenders, Metal and Plastic
- 8% growth in Heavy and Tractor-Trailer Truck Drivers
- 8% growth in Chemical Equipment Operators and Tenders
- 8% growth in Inspectors, Testers, Sorters, Samplers, and Weighers
- 7% growth in Food Processing Workers, All Other
- 7% growth in Tool and Die Makers
- 7% growth in Team Assemblers
- 7% growth in Packaging and Filling Machine Operators and Tenders
- 6% growth in Water and Wastewater Treatment Plant and System Operators
- 6% growth in Separating, Filtering, Clarifying, Precipitating, and Still Machine Setters, Operators, and Tenders
- 6,049 employed as Laborers and Freight, Stock, and Material Movers, Hand
- 5,448 employed as Team Assemblers
- 4,847 employed as Stockers and Order Fillers
- 4,480 employed as Heavy and Tractor-Trailer Truck Drivers
- 2,862 employed as Maintenance and Repair Workers, General
- 2,602 employed as Construction Laborers
- 2,366 employed as Light Truck Drivers
- 1,722 employed as Passenger Vehicle Drivers, Except Bus Drivers, Transit and Intercity
- 1,626 employed as Automotive Service Technicians and Mechanics
- 1,545 employed as First-Line Supervisors of Production and Operating Workers
- 1,385 employed as Industrial Truck and Tractor Operators
- 1,343 employed as Electricians
- 1,257 employed as Inspectors, Testers, Sorters, Samplers, and Weighers
- 1,221 employed as Welders, Cutters, Solderers, and Brazers
- 1,125 employed as Packaging and Filling Machine Operators and Tenders
- 1,028 employed as First-Line Supervisors of Construction Trades and Extraction Workers
- 1,019 employed as Packers and Packagers, Hand
- 974 employed as First-Line Supervisors of Mechanics, Installers, and Repairers
- 950 employed as First-Line Supervisors of Transportation and Material Moving Workers, Except Aircraft Cargo Handling Supervisors
- 898 employed as Operating Engineers and Other Construction Equipment Operators
- 887 employed as Meat, Poultry, and Fish Cutters and Trimmers
- 860 employed as Assemblers and Fabricators, All Other
- 826 employed as Industrial Machinery Mechanics
- 794 employed as Electrical, Electronic, and Electromechanical Assemblers, Except Coil Winders, Tapers, and Finishers
- 667 employed as Bus and Truck Mechanics and Diesel Engine Specialists
- 637 employed as Multiple Machine Tool Setters, Operators, and Tenders, Metal and Plastic
- 631 employed as Industrial Engineers
- 625 employed as Machinists
- 599 employed as Heating, Air Conditioning, and Refrigeration Mechanics and Installers
- 570 employed as Cutting, Punching, and Press Machine Setters, Operators, and Tenders, Metal and Plastic
- 550 employed as Helpers–Production Workers
- 493 employed as Printing Press Operators
- 449 employed as Coating, Painting, and Spraying Machine Setters, Operators, and Tenders
- 440 employed as Production Workers, All Other
- 429 employed as Food Batchmakers
- 411 employed as Molding, Coremaking, and Casting Machine Setters, Operators, and Tenders, Metal and Plastic
- 409 employed as Mechanical Engineers